 |
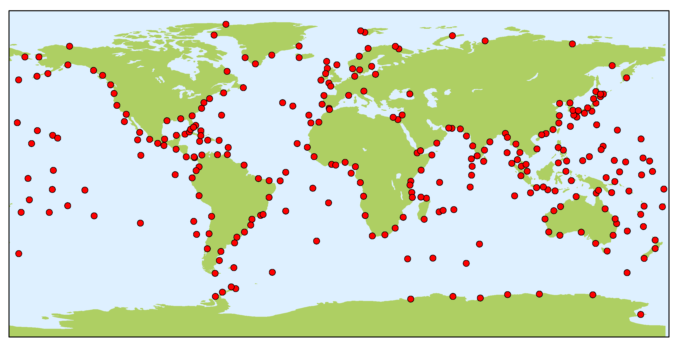
| Fig. 1 PSMSL: where it's at |
I. Background
The PSMSL folks updated their database a few days ago, so I updated my SQL server database accordingly.
This ties in with the recent updates to WOD databases, adding the DOY and Monthly views of temperatures and salinity, so I thought I would give the modules a run on the new data to generate the new picture on the Golden 23 zones (Calling All Cars: The Case of the "Missing Six" - 5).
Today, let's do that while revisiting the hypothesis that all of this effort deals with and is focused on (the "thermal expansion is the main cause of sea level rise" hypothesis).
In this series (On Thermal Expansion & Thermal Contraction, 2, 3, 4, 5, 6, 7, 8, 9, 10, 11, 12, 13) I have been discussing the lack of evidence for thermal expansion as the main cause of sea level rise (SLR).
The thermal expansion hypothesis was engendered by the IPCC:
"The pattern of sea level in ocean basins is maintained by atmospheric pressure and air-sea fluxes of momentum (surface wind stress), heat and fresh water (precipitation, evaporation, and fresh-water runoff from the land).(IPCC, emphasis added). Why did they leave out thermal contraction, along with a (suggested) complementary statement:The ocean is strongly density stratified with motion preferentially along density surfaces (e.g. Ledwell et al., 1993, 1998).
Fig. 2 Net thermal impact
This allows properties of water masses, set by interaction with the atmosphere or sea ice, to be carried thousands of kilometres into the ocean interior and thus provides a pathway for warming of surface waters to enter the ocean interior.
As the ocean warms, the density decreases and thus even at constant mass the volume of the ocean increases. This thermal expansion (or steric sea level rise) occurs at all ocean temperatures and is one of the major contributors to sea level changes during the 20th and 21st centuries."

As the ocean cools, even at constant mass the volume of the ocean decreases. This thermal contraction (or steric sea level fall) occurs at all ocean temperatures but neither it nor thermal expansion are major contributors to sea level changes during the 20th and 21st centuries. They are minor contributors.(See: On Thermal Expansion & Thermal Contraction, 12).
If the ocean temperature warms up X amount, then cools down the same X amount, the net change is zero (no expansion or contraction effect remains; see e.g. Fig. 2).
Even though leaving out the other side of the coin is absurd, that is exactly what the IPCC has done by asserting that no cooling or contraction is taking place in the oceans.
Several Dredd Blog series have shown, using WOD and PSMSL data, that the ocean temperatures go up and down at all ocean depth levels.
II. The Golden Twenty-Three Zones
 |
| Fig. 3 Sea level change |
The four-panel PSMSL graph at Fig. 3 shows the SLC that has taken place over the years in the subject 23 WOD zones.
 |
| Fig. 4a Year / Salinity |
 |
| Fig. 4b Year / Temperature |
For about a century the trend has been of the nature of sea level rise (SLR).
 |
| Fig. 5a Month / Salinity |
They show warming and cooling, meaning both expanding and contracting, with a net result that does not match the degree of the net result of the SLC in Fig. 3.
 |
| Fig. 5b Month / Temperature |
Those deep waters can and do absorb a tremendous amount of warmth (~95% or more) which CO2 trapped heat/sunlight generates.
That warming takes place without producing a constant, recognizable pattern which matches the SLR dynamically upward pattern.
 |
| Fig. 6a Day of Year / Salinity |
III. Why The Golden 23
The graphs today focus on the Golden 23 Zones where the Golden 23 tide gauge stations are located.
Those are the choice of experts such as Jerry Mitrovica and Douglas because they present a view of SLC that balances the hemispheric SLC (see video here).
Too much north, or too much south can throw researchers off (remember "the European problem?").
So, both the SLC graph (Fig. 3) and the salinity and temperature graphs (Fig. 4a - Fig. 6b) are from PSMSL tide gauge measurement and WOD water measurement datasets from the Golden 23 zones.
IV. Conclusion
I am reiterating this information because as we traverse through the layers with the new (Year, Day of Year, and Monthly) graph views generated from the WOD water temperature and salinity records, we need to remember that there is a purpose to it.
 |
| Fig. 6b Day of Year / Temperature |
We are questioning the "sacred cow" of the scientists who think "thermal expansion is the major cause of sea level rise."
Meanwhile, we can learn even more details about the vast ocean's many curiosities.
Ok, I have to get back to work on the other levels.
The next post in this series is here, the previous post in this series is here.
"A Series of Dreams ..."
No comments:
Post a Comment